SETU.fyi
A handy student evaluation visualiser
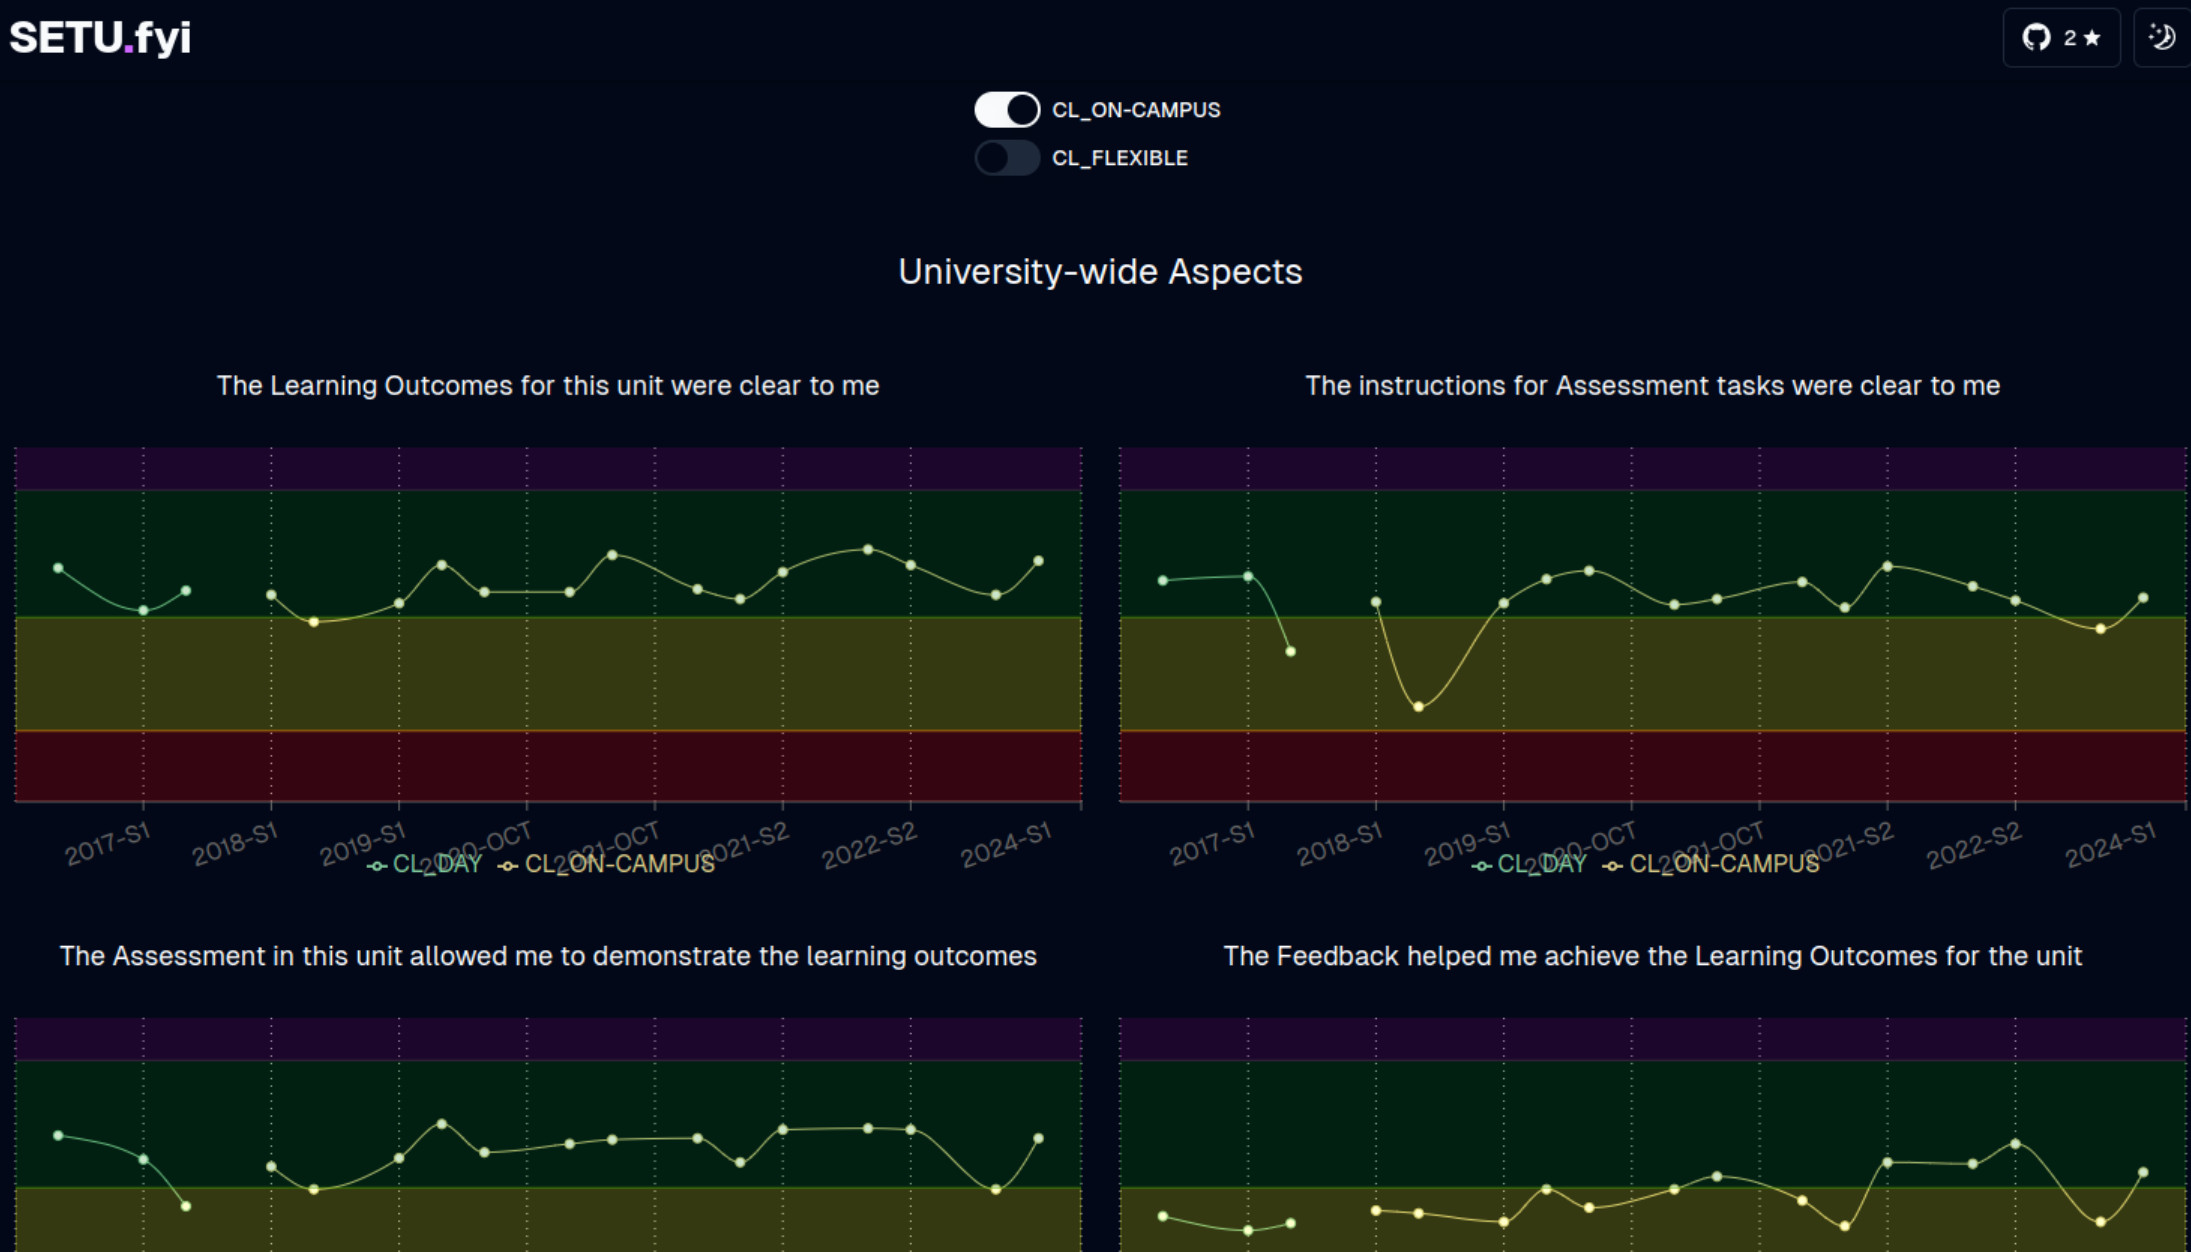
This is a quick project I started up to help perform some basic data analysis into student evaluations at Monash University. It's a very much a work-in-progress as I can't dedicate much time on it, but at a minimal data visualisation tool, it works.
It is build using NextJS and React, as well as Recharts for the data visualisation. In the backend is a collection of Python scripts that scrape all of the data from each unit report which is then uploaded to the database. From there, the data is pulled into the frontend and displayed in a series of graphs and tables. Future development will include breakdowns for each faculty, course, degree, campus, and so on, all feature within a highly integrated an interactive interface.
Why did I make this, though? Well, like most of my projects, this started as a set of spreadsheets which which I was using to help decide where my team would focus our efforts in future unit offerings. Because I wan only interested in my unit, I elected to do the data scraping by hand, which was tedious, but much faster that 'doing it properly', though I soon decided to expand this data visualisation tool to include another unit... and then another and another. Before I knew it, I was writing the webscraper, and a whole new website to display the data. A bit of scope creep, but it was done in a weekend and it was a great learning experience working with so much data.